MOSAIC (MOS)·Q4 2025 Earnings Summary
Mosaic Posts Q4 Loss on Notable Items; Full Year EBITDA Tops $2.4B
February 24, 2026 · by Fintool AI Agent
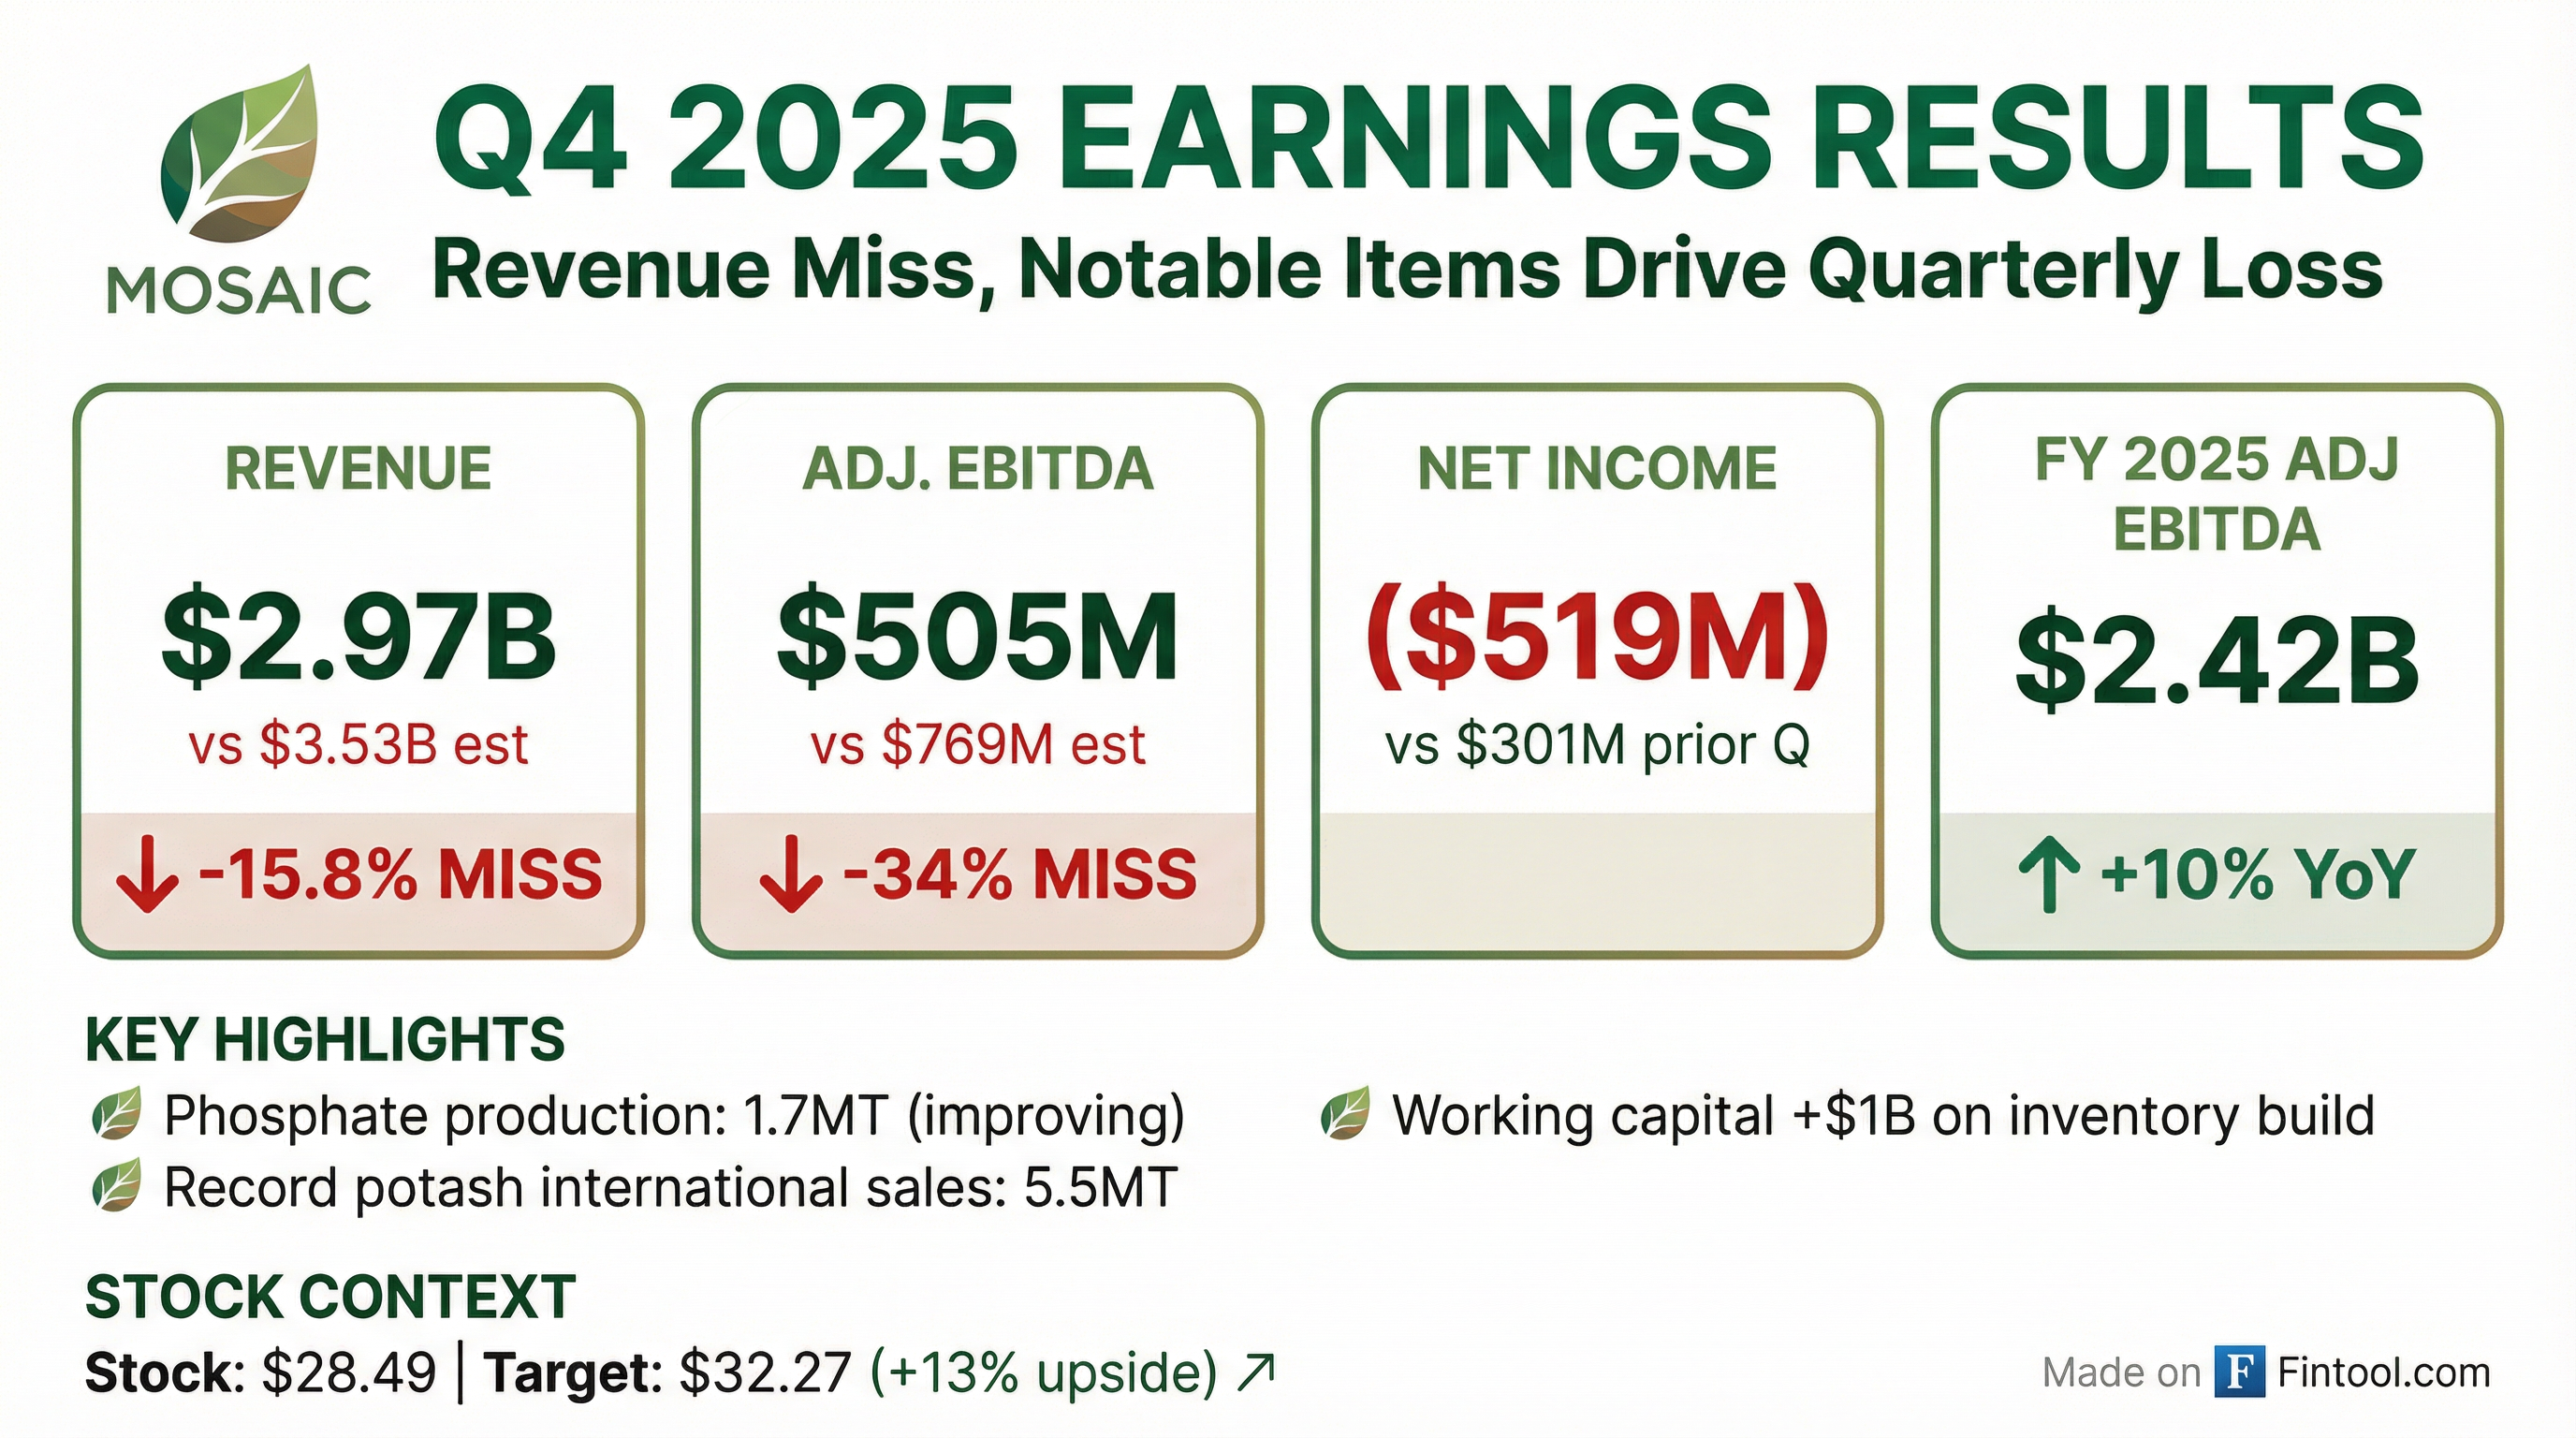
Mosaic Company (NYSE: MOS) reported Q4 2025 results that missed consensus expectations across key metrics, with revenue of $2.97B falling 15.8% below the $3.53B estimate and a net loss of $519M driven by $414M in notable items . Despite the weak quarter, full year 2025 performance was solid with adjusted EBITDA of $2.42B and net income of $541M . The stock closed at $28.49 on February 24, with earnings released after market close.
Did Mosaic Beat Earnings?
No. Mosaic missed on all key metrics in Q4 2025:
*Values retrieved from S&P Global
The quarterly loss was driven by $414M in notable items that impacted results, including write-downs and charges . On an adjusted basis, Q4 EBITDA of $505M was below expectations but represented the impact of soft U.S. demand in phosphates and challenging market conditions in Brazil.
Full Year 2025 Performance
The full year tells a better story:
How Did Each Segment Perform?
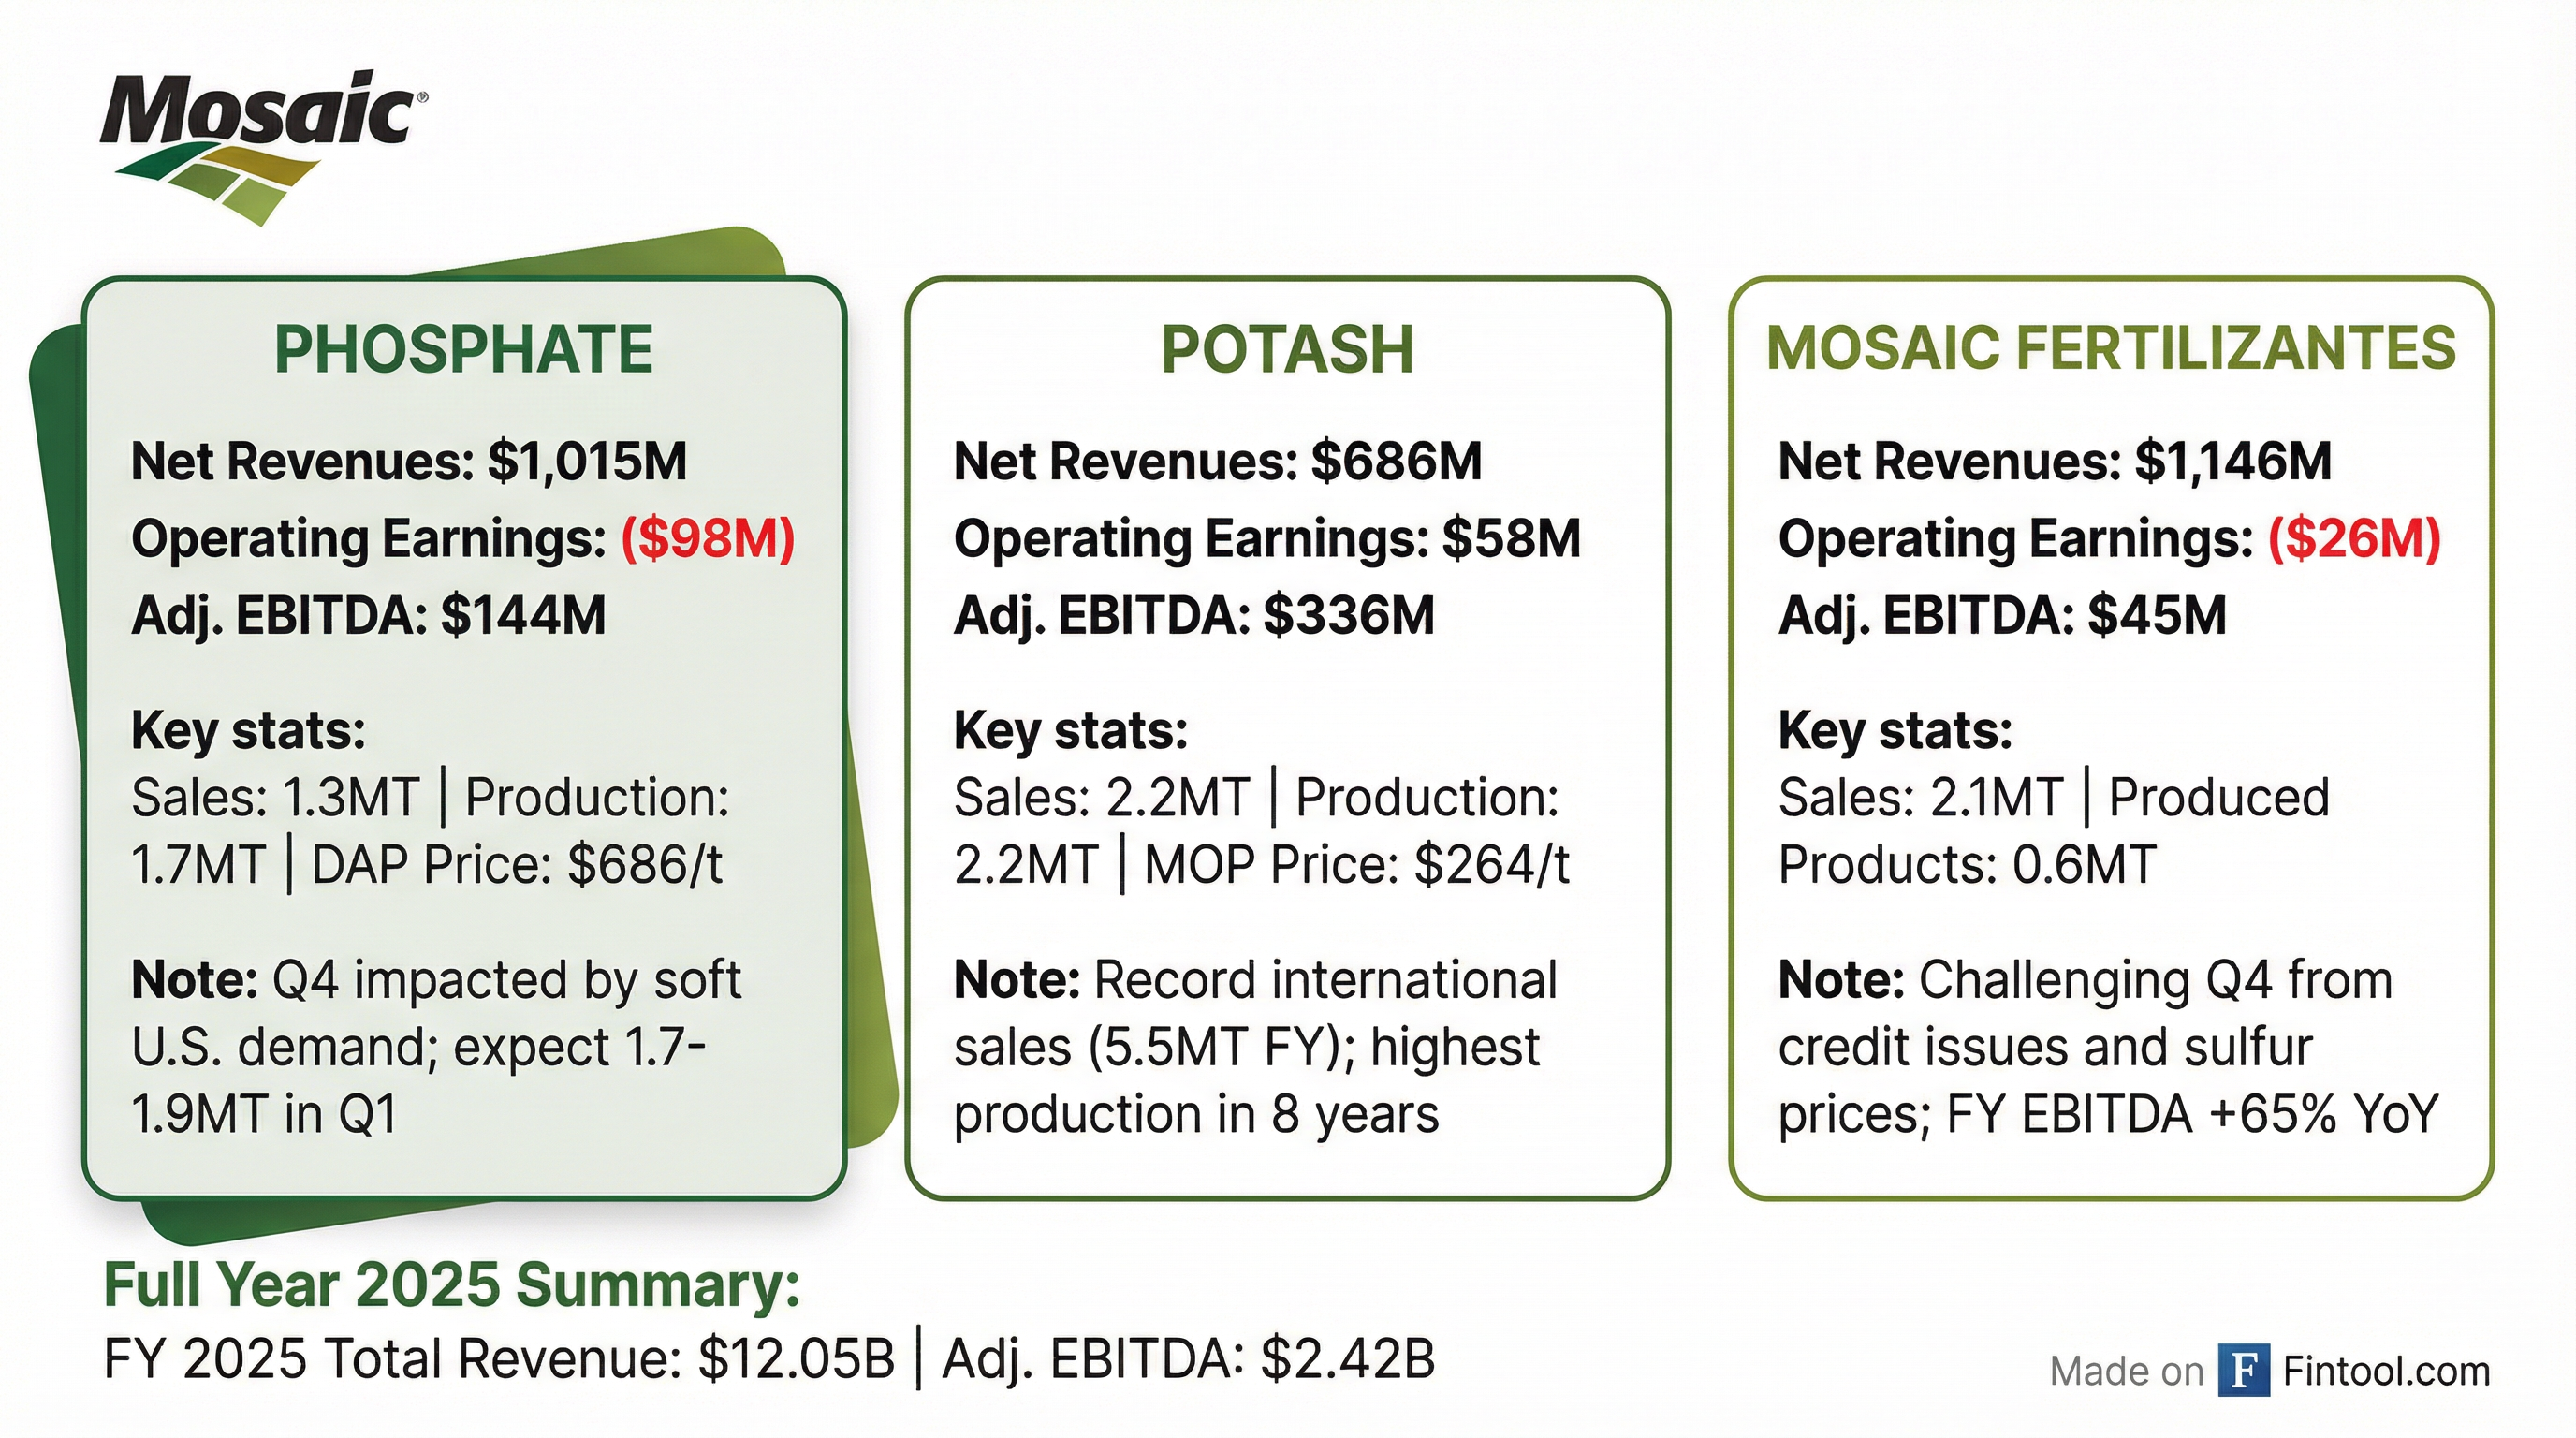
Phosphate: Soft Q4 Demand, But Production Improving
Key takeaways:
- Q4 sales volumes of 1.3MT were impacted by soft U.S. demand; management expects recovery to 1.7-1.9MT in Q1 2026
- Cash cost of conversion improved to $112/t, down 16% from the high-water mark earlier in 2025
- North America phosphoric acid production trending higher — Q4 2025 at 770K MT vs 635K MT in Q4 2024
- Near-record phosphate rock production of 14.6MT for FY 2025
Potash: Record International Performance
Key takeaways:
- Record international sales volumes of 5.5MT for full year, contributing to strong results
- Highest MOP production in 8 years despite lower-than-expected Q4 volumes
- Signed Carlsbad sale agreement with ~$30M expected value and ~$20M ARO reduction
Mosaic Fertilizantes: Challenging Q4, Strong Full Year
Key takeaways:
- Q4 results negatively impacted by credit challenges, intensified competition, and rapid rise in sulfur prices
- Full year Adjusted EBITDA of $567M was up 65% YoY, the third highest in operating history
- Cost management focus yielded blended rock costs of $97/t in 2025, lowest since 2021
How Did the Stock React?
Earnings were released after market close on February 24, 2026. The stock closed at $28.49 (-1.69% on the day). Key context:
*Values retrieved from S&P Global
The stock has rallied from the November 2025 lows near $23 but remains 25% below the 52-week high. The analyst target price of $32.27 implies 13% upside from current levels.
What Did Management Guide?
Q1 2026 Outlook
Full Year 2026 Guidance
Pricing Sensitivities
Management provided helpful sensitivities for modeling :
- DAP: $10/t price change = $80M Adjusted EBITDA impact
- MOP: $10/t price change = $65M Adjusted EBITDA impact
What Changed From Last Quarter?
Negative developments:
- Revenue declined significantly — Q4 at $2.97B vs Q3 at $3.45B (-14%)
- Notable items of $414M created a large quarterly loss
- Working capital increased by $1.0B due to inventory build
- Free cash flow was negative at ($535M) for full year 2025
- Debt increased — higher working capital needs drove borrowing
Positive developments:
- Phosphate production improving — Q4 at 1.7MT with momentum continuing into 2026
- Cost reductions achieved — $150M value capture target met in 2025, additional $100M targeted for 2026
- Record potash international sales — 5.5MT for the full year
- Mosaic Biosciences growing — Positively contributed to Q4 EBITDA, net sales expected to double in 2026
Capital Allocation and Balance Sheet
Cash Flow and Leverage
2026 Priorities
Management outlined capital priorities for 2026 :
- Regular dividend — maintaining $280M annual pace
- Debt paydown — top priority after working capital normalizes
Working Capital Build
The $1.0B increase in working capital was driven by inventory :
- Raw materials up $346M from higher sulfur prices and elevated rock inventories
- Finished goods up $428M from price increases and inventory build in North America and Brazil
- Management expects rock inventories to decrease as phosphate production continues improving
- Finished goods to reverse over the next few quarters
Strategic Updates
Asset Monetization Progress
Value Capture Initiative
Having achieved the $150M cost reduction target in 2025, Mosaic is targeting an additional $100M in 2026 through :
- Further cost reductions with focus on North America operations
- Supply chain efficiencies — optimizing excess inventories, scrap, demurrage
- Improved pricing, netbacks, and margin optimization
- Contract management using AI to prevent "over-invoicing"
- Shared services transformation
- Further reduction in administrative functions
Mosaic Biosciences Growth
The biologicals and micronutrients business achieved several milestones :
- Positively contributed to Q4 Adjusted EBITDA
- Successfully launched 5 new products in 2025
- Expanded to 16 countries with 60+ registrations
- Net sales targeted to double again in 2026
Market Outlook
Phosphate Market
- Global demand still constrained by supply; Chinese export policy could further trim supply
- DAP affordability improved in Q4, with prices increasing as seasonal demand builds
- Stripping margins at five-year lows on higher raw material prices, pressuring producer economics
Potash Market
- Affordability driving demand growth with largely balanced supply/demand supporting stable prices
- Low Brazil and China inventory levels (stocks-to-use at 15-16%) support 2026 demand
Agricultural Fundamentals
- Crop prices remain range-bound at levels supportive of fertilizer demand
- Brazil planted area expanding (93.8M Ha in 25/26, 95.9M Ha expected in 26/27), requiring fertilizer to drive yield increases
Forward Catalysts
Near-term (Q1-Q2 2026):
- Q1 2026 volume recovery in Phosphate (guided 1.7-1.9MT vs 1.3MT in Q4)
- Working capital release as inventories normalize
- Additional asset monetization deals expected
Medium-term (2026):
- Phosphate production target of 7.0+ MT (highest in recent years)
- $100M additional value capture from cost initiatives
- Mosaic Biosciences sales doubling
- Niobium opportunity at Araxa/Patrocinio advancing
Risks to watch:
- Chinese phosphate export policy (additional restrictions could further tighten supply)
- Raw material cost volatility (sulfur, ammonia)
- Brazil credit conditions and agricultural market health
- Working capital management and debt levels
Data sourced from Mosaic Company Q4 2025 earnings materials released February 24, 2026. Consensus estimates from S&P Global.
Related Links: